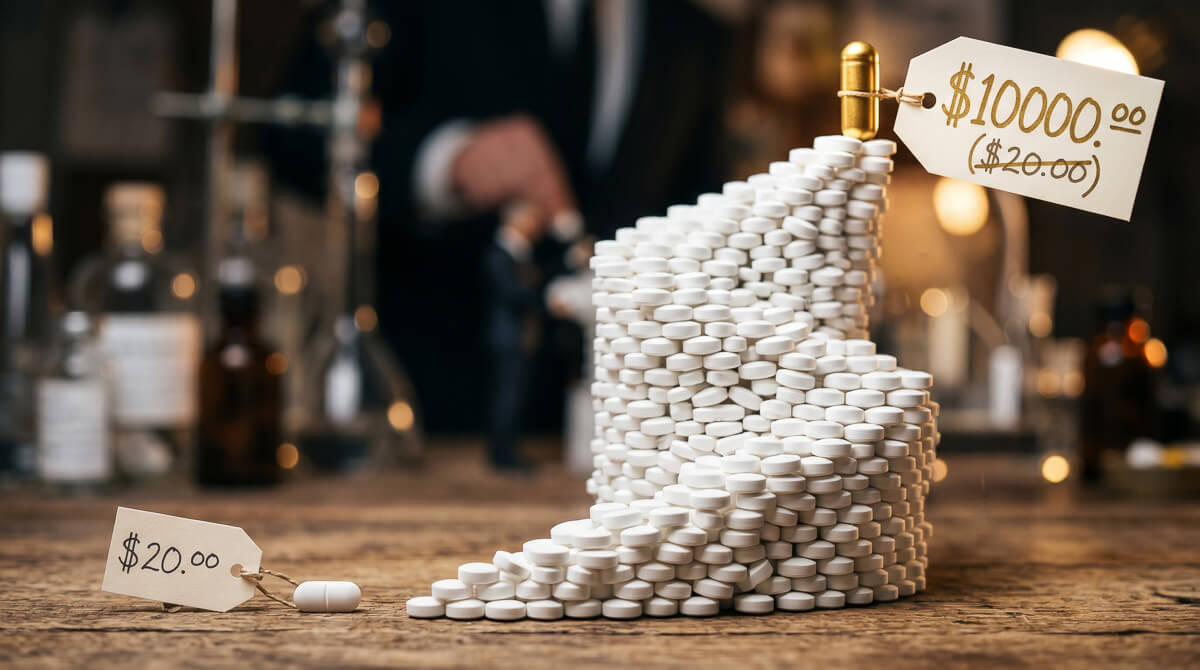
Imatinib mesylate is a generic drug that treats chronic myelogenous leukemia. Pharmacies can acquire a 30-day supply for about $96. Mark Cuban’s Cost Plus Drugs sells it for $47: manufacturer cost plus a flat 15% markup, a pharmacist fee, and shipping. Through a traditional pharmacy channel, the listed retail price for that same 30-day supply can exceed $10,000.
Between the factory and the patient sits a chain of middlemen, pharmacy benefit managers, insurers, specialty pharmacies, often all owned by the same parent company, each adding cost while making it harder to see what anything actually costs.
The imatinib gap is the whole system in miniature. The US pays more than any wealthy nation for worse outcomes, and a growing share of that excess flows not to doctors, hospitals, or drug manufacturers, but to the administrative machinery that sits between them.
Updated April 20, 2026: The hospital-payment section has been updated to reflect physician perspectives shared on r/medicine after publication. Those observations are presented qualitatively throughout.
US healthcare costs have broken away from peer countries
Every wealthy country has seen healthcare costs rise, but the US broke from the pack around 2000 and the gap has been widening ever since.
In 2022, the US spent $12,586 per person on healthcare. Japan spent $5,846. Even Switzerland, the second-most-expensive system, spent $2,000 less per person.
Despite record spending, Americans live shorter lives than people in every peer country
If the extra spending bought better health, it would be a defensible tradeoff. It doesn’t. The excess goes somewhere else.
American life expectancy was 78.0 years in 2022, while Japan reached 84.1, Switzerland 83.2, and Sweden 83.0. Japan’s gap is the starkest: $6,740 less per person per year, and 6.1 more years of life. The Commonwealth Fund’s Mirror Mirror report has ranked the US last among wealthy nations for health system performance three times running. The one category where the US scores near the top is clinical care process, the quality of treatment once a patient actually gets into the system. The problem is everything that happens before and after: the paperwork, the pricing, the billing, the layers of companies between the patient and the doctor.
Americans pay 50-250% more for the same drugs
So where does the extra money go? The most direct answer starts with pharmaceuticals.
Americans spent $1,713 per person on pharmaceuticals in 2023, 47% more than Germany ($1,168), 63% more than Canada ($1,052), and 2.4 times what Sweden paid ($713). The Netherlands spent even less at $485 per person. These countries aren’t buying inferior drugs. They’re buying many of the same branded medications at prices their governments negotiated down.
Most peer nations use centralized authorities to negotiate drug prices, and they can credibly threaten to exclude a drug from coverage if the price isn’t acceptable. The US has historically lacked that leverage. Medicare was legally prohibited from negotiating drug prices until the Inflation Reduction Act of 2022.
But negotiation is only part of the story. The deeper question is what happens between the factory and the patient, and why the same generic drug can cost 100 times more depending on which channel it flows through.
The drug pricing supply chain: where a $96 drug becomes $10,000
A generic drug has a real cost to acquire: the National Average Drug Acquisition Cost (NADAC), calculated by the Centers for Medicare & Medicaid Services (CMS) from actual pharmacy invoices. That’s what pharmacies really pay to stock a drug. Then there’s what patients actually pay. The gap between those two numbers is where the story lives.
The pharmacy acquires imatinib for $96 through distributors. Cost Plus sells it for $47 by buying direct from the manufacturer and skipping the distribution chain entirely. A patient walking into a traditional pharmacy without insurance can face a listed retail price over $10,000 for the same generic pill. Most insured patients pay less through copays, but the gap between acquisition cost and list price remains enormous. The branded version, Gleevec, was priced above $120,000 per year by the time its patent expired.
The pattern repeats across every drug in the table. How does a $96 drug become $10,000? Through a chain of intermediaries, each adding cost while obscuring the actual price.
Three companies control 80% of your prescriptions
The most powerful intermediaries in the drug pricing chain are pharmacy benefit managers (PBMs). They sit between insurers, pharmacies, and drug manufacturers, theoretically negotiating lower prices on behalf of employers and health plans. In practice, the three largest have become vertically integrated conglomerates that profit from the complexity they were supposed to reduce.
Each parent company owns the insurer that decides coverage, the PBM that negotiates the price, and the pharmacy that fills the prescription. Together, these three conglomerates process about 80% of all prescription claims in the US, covering roughly 270 million people. When the same company controls all three steps, it has every reason to keep prices high across the chain rather than fight to lower them for patients.
The FTC’s 2025 report on PBMs examined 51 specialty generic drugs and found that the Big 3’s affiliated pharmacies generated more than $7.3 billion in revenue from dispensing these drugs above their acquisition costs between 2017 and 2022. The markup rate grew at a 42% compound annual growth rate from 2017 to 2021. These aren’t obscure drugs. They include generic versions of Gleevec (imatinib’s brand name), drugs for MS, transplant rejection, and kidney disease.
PBM advocates argue that rebate negotiations create pricing pressure that lowers net costs for plan sponsors. There’s some truth to this. But when the FTC examined the full picture, PBM-affiliated pharmacy markups on specialty generics far exceeded any rebate savings flowing to patients. The “savings” often circulate within the same corporate parent, not back to the people paying copays.
When the government negotiates, prices drop 38-79%
The Inflation Reduction Act of 2022 gave Medicare the authority to negotiate drug prices for the first time. The first 10 drugs were announced in 2024, with negotiated prices taking effect in January 2026.
Januvia, a diabetes drug taken by 843,000 Medicare beneficiaries, dropped 89%, from $1,015 to $113 per 30-day supply. Eliquis, a blood thinner that cost Medicare $18.3 billion in 2023 alone, fell 73%, from $862 to $231. Jardiance, Xarelto, and Farxiga all dropped roughly 80%.
These 10 drugs accounted for $56.2 billion in Medicare Part D spending in 2023. CMS projects the negotiated prices will save Medicare $6 billion and beneficiaries $1.5 billion in out-of-pocket costs in 2026 alone. The program is expanding: 15 more drugs for 2027, another 15 for 2028, and 20 per year after that.
One round of negotiation on just 10 drugs saves $6 billion. Medicare covers thousands of drugs. And these discounts of 38-79% are not manufacturers taking a loss. They’re manufacturers accepting prices closer to what every other developed country already pays.
The US spends $306 billion per year just to administer health insurance
The drug pricing chain is one piece of a larger pattern. The US doesn’t just overpay for drugs and treatments. It overpays to manage the system itself.
The US spent $1,010 per person in 2022 on healthcare administration, more than double any peer country. Sweden spent $92, Japan $111, the UK $107. Even Germany, which has a complex multi-insurer system, spent only $370.
In absolute terms, the “Net Cost of Health Insurance” in the National Health Expenditure accounts reached $306 billion in 2024, the difference between what insurers collect in premiums and what they pay out in claims. That’s more than the country spent on dental care ($189 billion) or home health ($169 billion). This is the cost of operating a system where a single hospital might negotiate with dozens of insurers, each with its own billing codes, approval requirements, and payment rates.
Hospitals spent $43 billion in 2025 just getting paid
What happens between the insurer charging an employer’s health plan and the hospital actually receiving payment? According to the AHA’s 2026 Costs of Caring report: a lot of expensive friction. In 2025, hospitals spent $43 billion collecting payments that insurers owed for care already delivered, including $18 billion on claims denial appeals alone. The average hospital employs 64 dedicated billing and administrative staff, roughly 6.5% of its workforce, whose job is navigating the payment system rather than caring for patients.
Payment collection costs alone consumed about 2.6% of total hospital expenses in 2025. Factor in denial appeals ($18 billion), cybersecurity ($30 billion), and the broader administrative infrastructure, and hospitals are spending well over 8% of their budgets navigating the payment system rather than delivering care.
CAQH puts total administrative transaction costs across the industry at $83 billion a year, and providers shoulder 97% of them. The denial numbers are stark. A Health Affairs analysis cited in the AHA report found that Medicare Advantage plans denied 17% of initial claims submissions, and 57% of those denials were ultimately overturned. The net effect: a 7% reduction in provider MA revenue from denials that stick, plus billions in friction costs from the ones that don’t.
But the 17%/57% headline collapses at least three very different problems into one number. After this article was published, physicians across specialties described the denial loop from the inside in a discussion on r/medicine. A large share of denials appear to be documentation gaps: the initial submission was incomplete or missing clinical context, and the “appeal” is really just the first real submission with proper paperwork attached. In other cases, denials come back in minutes or seconds, with no sign that anyone actually read the file. The appeal that follows is a peer-to-peer phone call where a reviewing physician reads the ordering physician’s own clinical note back to them and approves it. A third pattern arises when payer intake systems simply fail to receive submitted documents, so the appeal is the only path that triggers human review at all. All three show up as “denied, then overturned” in the aggregate data. They are not the same problem.
Multiple physicians independently described Medicare Advantage and Medicaid managed-care plans as notably more adversarial than commercial payers in their denial practices, though that observation hasn’t been systematically measured.
Denying first pays, but only because of a variable that doesn’t appear in any public dataset: the share of denied claims that go unappealed. If every denial were contested, the 57% overturn rate would make routine denials a net loss for payers. But not every provider has the staff to fight, and not every patient has the energy. The non-appeal rate, the fraction of legitimate claims that get denied and then abandoned, is the number that makes the whole system work. Nobody tracks it.
The gap between what insurers charge employers and what hospitals actually receive is widened by structural forces. Medicare reimburses hospitals at 83 cents on the dollar, creating over $100 billion in underpayments in 2024 alone. That shortfall gets cost-shifted to commercially insured patients.
Most of those patients are covered through their employers. According to KFF’s 2024 survey, 67% of covered workers are in “self-funded” plans, meaning their employer pays claims directly rather than buying a traditional insurance policy. The insurer just administers the paperwork. At large firms, that figure is 80%.
Self-funded plans carry a regulatory consequence most employees never encounter until a claim goes wrong. Because these plans are governed by ERISA, the federal Employee Retirement Income Security Act, they fall outside the jurisdiction of state insurance commissioners. When a fully insured plan misses a payment deadline or refuses to explain a coverage decision, the employee can escalate to a state regulator with enforcement power. When a self-funded plan does the same thing, there is no comparable external authority. For the 67% of covered workers in self-funded arrangements, the appeals process ends with the plan administrator, typically the same entity that denied the claim.
More than half of all hospital service lines operate at a loss, and it’s largely those self-funded employer plans absorbing the shortfall. Together, these money-losing lines account for 56% of hospital costs.
Behavioral health reimburses at 74.5 cents on the dollar. Burns and wound care, infectious disease, trauma, obstetrics: all negative margin. Trauma, obstetrics, behavioral health: the services hospitals can’t turn away. Hospitals cross-subsidize them from the few service lines that do generate positive margins, but that cross-subsidy comes from commercially insured patients, who are largely covered by self-insured employers.
The opacity isn’t just external. Several physicians in the same thread described being unable to get visibility into their own departments’ billing and reimbursement numbers. If hospitals themselves can’t see which payers reimburse above cost and which don’t, the cross-subsidy math above is being managed in aggregate, not optimized. This also complicates any argument that hospitals could bypass insurers by contracting directly with employers: a direct contract requires knowing your own costs and margins precisely, and that internal transparency appears to be the exception rather than the rule. The opacity itself is largely a product of the intermediary layer: a hospital negotiating with dozens of payers across dozens of plan types has no single price to optimize against.
Hospitals are spending $43 billion a year navigating a payment system that denies 17% of claims and reimburses Medicare patients at 83 cents on the dollar. The shortfall gets cost-shifted to employer plans. A meaningful share of those denials appear to be automated rather than substantive, those employer plans sit outside state regulatory oversight, and the aggregate numbers obscure mechanics that are messier than a single overturn rate suggests. Hospital expenses grew 7.5% in 2025 while hospital prices grew only 3.3%. The gap between what hospitals charge and what they spend is narrowing, not widening. The intermediary layer is what keeps expanding.
Where America’s $5 trillion in healthcare spending actually goes
In 2024, the United States spent $5.04 trillion on healthcare, more than the entire GDP of Japan.
Prescription drugs at $467 billion and insurance overhead at $306 billion jump out. And the $306 billion understates the real administrative burden, because it only counts the insurer side. It doesn’t include the $43 billion hospitals spend on payment collection, $18 billion on denial appeals, or the $83 billion in total admin transaction costs the CAQH estimates across all providers.
In 2000, the net cost of health insurance was $63 billion. By 2024, it reached $306 billion, a nearly five-fold increase that grew faster than every major clinical spending category.
The pharmaceutical industry’s strongest counterargument is that higher US prices subsidize R&D for the rest of the world. There’s something to this, but manufacturers set those prices themselves, and if global R&D genuinely needs cross-subsidization, concentrating the entire burden on one country is a strange way to structure it. It also doesn’t explain why hospital administration costs $1,010 per person or why insurers take $306 billion off the top before paying a single claim.
The weaker objections are that Cost Plus only covers generics, not complex biologics, and that the “$10,000 retail price” is a list price most insured patients don’t pay in full. Both are true and both miss the point. Generic drugs account for 90% of prescriptions dispensed in the US. And list prices matter because coinsurance, where patients pay a percentage of the drug’s price rather than a flat copay, is increasingly standard, meaning the list price is exactly what many patients owe.
The structural picture doesn’t change. When negotiation actually happens, prices drop 38-79% without manufacturers refusing to participate.
The imatinib story is a miniature of the entire system. A product with a knowable, verifiable cost gets marked up through a chain of intermediaries, each with an incentive to keep prices opaque. The insurance industry takes $306 billion off the top before a single claim is paid. PBM-affiliated pharmacies generated $7.3 billion in excess revenue from just 51 specialty generics over five years. And when someone cuts through the chain, prices drop immediately.
The price-reduction math isn’t complicated. Cost Plus figured it out with a spreadsheet. Medicare negotiators got 38-79% off on the first try. Every other wealthy country has been doing it for decades. The interesting question is who benefits from pretending it’s complicated.
Why this article exists
I started with the imatinib number because it’s almost unbelievable until you understand the mechanism. A $96 drug with a $10,000 list price sounds like a typo. It’s not. And the data to prove it, the NADAC, what pharmacies actually pay, is a public CMS dataset updated monthly. Nobody hides it. It just lives in a format that requires knowing it exists, knowing what it’s called, and being able to join it against retail price data from a completely different source.
That’s the pattern across the entire healthcare system. The FTC’s PBM report is public. The CMS National Health Expenditure data is public. The IRA negotiated prices are public. The OECD health statistics are public. None of it is secret. All of it is hard to work with, spread across agencies in incompatible formats, and most people who could use it spend their time wrestling with the data instead of asking questions about it.
OpenData is what I built to fix that. Every dataset in this article, NADAC, Part D spending, IRA prices, OECD health expenditure, AHA cost data, is queryable through a single API with consistent schemas. You can look up any drug by name, compare what Medicare paid versus what the IRA negotiated, or filter the NADAC by NDC code. No series code lookups, no Excel footnotes, no fixed-width files.
Every chart above links to its source data. If you disagree with a conclusion, you can run the same query and check. That’s the point.
Datasets used:
-
owid/healthcare-spending— Per-capita healthcare spending in USD PPP for 10 high-income countries, 2000-2022 -
owid/life-expectancy— Life expectancy at birth by country, 2022 -
oecd/health-expenditure-by-function— Per-capita administration/governance spending, 2022 -
oecd/pharma-spending— Per-capita pharmaceutical spending, 2023 -
cms/nhe-by-category— US National Health Expenditure by category, 2000-2024 -
cms/nadac— National Average Drug Acquisition Cost per unit, March 2026 vintage -
cms/ira-drug-prices— Medicare negotiated Maximum Fair Prices, effective 2026 -
cms/part-d-spending— Medicare Part D spending by drug, 2023 data year -
aha/costs-of-caring— Hospital financial and operational metrics from the AHA Costs of Caring 2026 report: payment friction ($43B collection, $18B denial appeals), Medicare underpayment ($100B), billing staff counts, denial rates. Underlying data from Strata Decision Technology, KFF, Health Affairs, CAQH. Source: aha.org/costsofcaring -
aha/service-line-margins— All-payer operating margins by hospital service line, 2025. Source: AHA analysis of Strata Decision Technology benchmark data. PDF
Non-API sources:
- Cost Plus Drugs prices: CostPlus and implications for generic imatinib, Lancet Regional Health Americas (2023), PMID: 36777318.
- FTC PBM report: Specialty Generic Drugs: A Growing Profit Center for Vertically Integrated PBMs, FTC Second Interim Staff Report, January 2025.
- IRA list prices (WAC): Medicare Rights Center citing CMS announcement, October 2025.
- PBM market share: Drug Channels annual PBM report, March 2025.
- Traditional retail prices: GoodRx and SingleCare average retail price estimates, April 2026.
- KFF Employer Health Benefits Survey 2024: Self-insured employer share (67% of covered workers).
- CAQH 2024 Index Report: $83 billion all-provider administrative transaction costs, 97% provider share.
- r/medicine discussion (April 2026): Physician-reported observations on denial mechanisms, non-appeal rates, MA/Medicaid managed-care behavior, internal billing opacity, and ERISA preemption. Qualitative; no individual commenters cited.
Calculations & transformations: NADAC per-unit costs converted to 30-day supply costs using standard dosing regimens: imatinib 400mg = 1 tab/day x 30; celecoxib 200mg = 1 cap/day x 30; fingolimod 0.5mg = 1 cap/day x 30; abiraterone 250mg = 4 tabs/day x 30; enbrel 50mg/mL = 1 mL/week x 4. Drug price comparison chart uses log scale because the ratio between acquisition cost and retail price spans 2-3 orders of magnitude; linear scale would make the lower-cost bars invisible. IRA chart also uses log scale for the same reason.
Limitations: NADAC reflects average pharmacy acquisition costs and may differ from specific pharmacy costs. Cost Plus Drugs prices are mail-order only and exclude drugs requiring cold chain or specialty handling. “Traditional retail price” varies widely; we use average cash price estimates from GoodRx/SingleCare, which represent list prices before any insurance or coupon application. The FTC’s $7.3 billion figure covers specialty generics only (51 drugs, 882 NDCs, 2017-2022); the full scope of PBM markups across all drugs is unknown. IRA negotiated prices apply only to Medicare Part D beneficiaries and do not directly affect commercial insurance pricing. OECD PPP-adjusted comparisons embed price-level differences, meaning raw currency comparisons would show an even larger US gap.
Data accessed on 2026-04-19; denial-mechanism section updated 2026-04-20 via the OpenData API.