
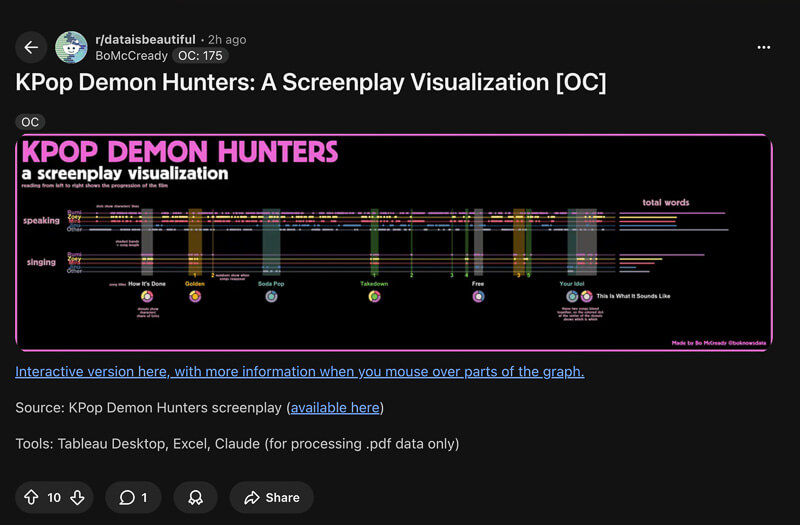
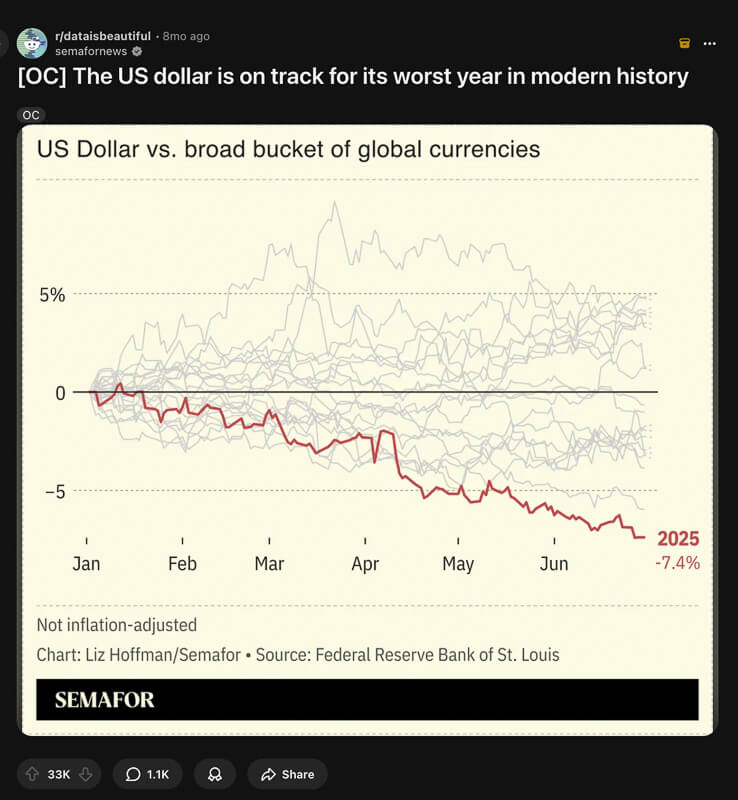
Spend five minutes on r/dataisbeautiful and you’ll notice something that doesn’t make sense. A gorgeous, multi-layered D3 visualization with custom projections and interactive tooltips sits at 47 upvotes. Three posts down, a plain bar chart with a punchy headline has 15,000. The first one took someone a weekend. The second probably took 20 minutes.
If you’ve spent years getting good at charting tools, that feels deeply unfair.
But it’s not random. The simple chart communicates a single clear insight. The complex one asks the viewer to find one. On social media, nobody’s doing that work.
The Complexity Trap
Data people over-index on technical sophistication. Multi-axis charts, custom color palettes, carefully tuned interactivity. These things are impressive to other data people. They’re invisible to everyone else.
The issue isn’t skill. It’s that there are two fundamentally different activities that both get called “data visualization,” and most people use the tools and habits of one to do the other.
Exploratory visualization is what you do when you’re trying to understand your data. You plot everything, slice it every possible way, zoom in on anomalies. The audience is you, and the goal is discovery.
Communication visualization is what you do when you already know the insight and need someone else to get it quickly. The audience is everyone, and the goal is transfer. One idea, transmitted clearly, in seconds.
The tools most of us learned (Matplotlib, ggplot2, Seaborn, D3) are exploration tools. They’re designed to be flexible, to show everything so you can find anything. Their defaults reflect that: dense gridlines, axes that scale to fit whatever data you throw at them, legends that list every series.
Those defaults produce charts that are functional for analysis and nearly useless for communication. The most shared visualizations on the internet are almost always the simplest. Not because their creators lack skill, but because they understood which activity they were doing.
What Chartr Actually Does
Chartr is a data-driven newsletter that grew to over 500,000 subscribers. Each edition features a handful of clean, simple graphics covering business, tech, and economics. Nothing technically complex. Just disciplined.
Look at this one:
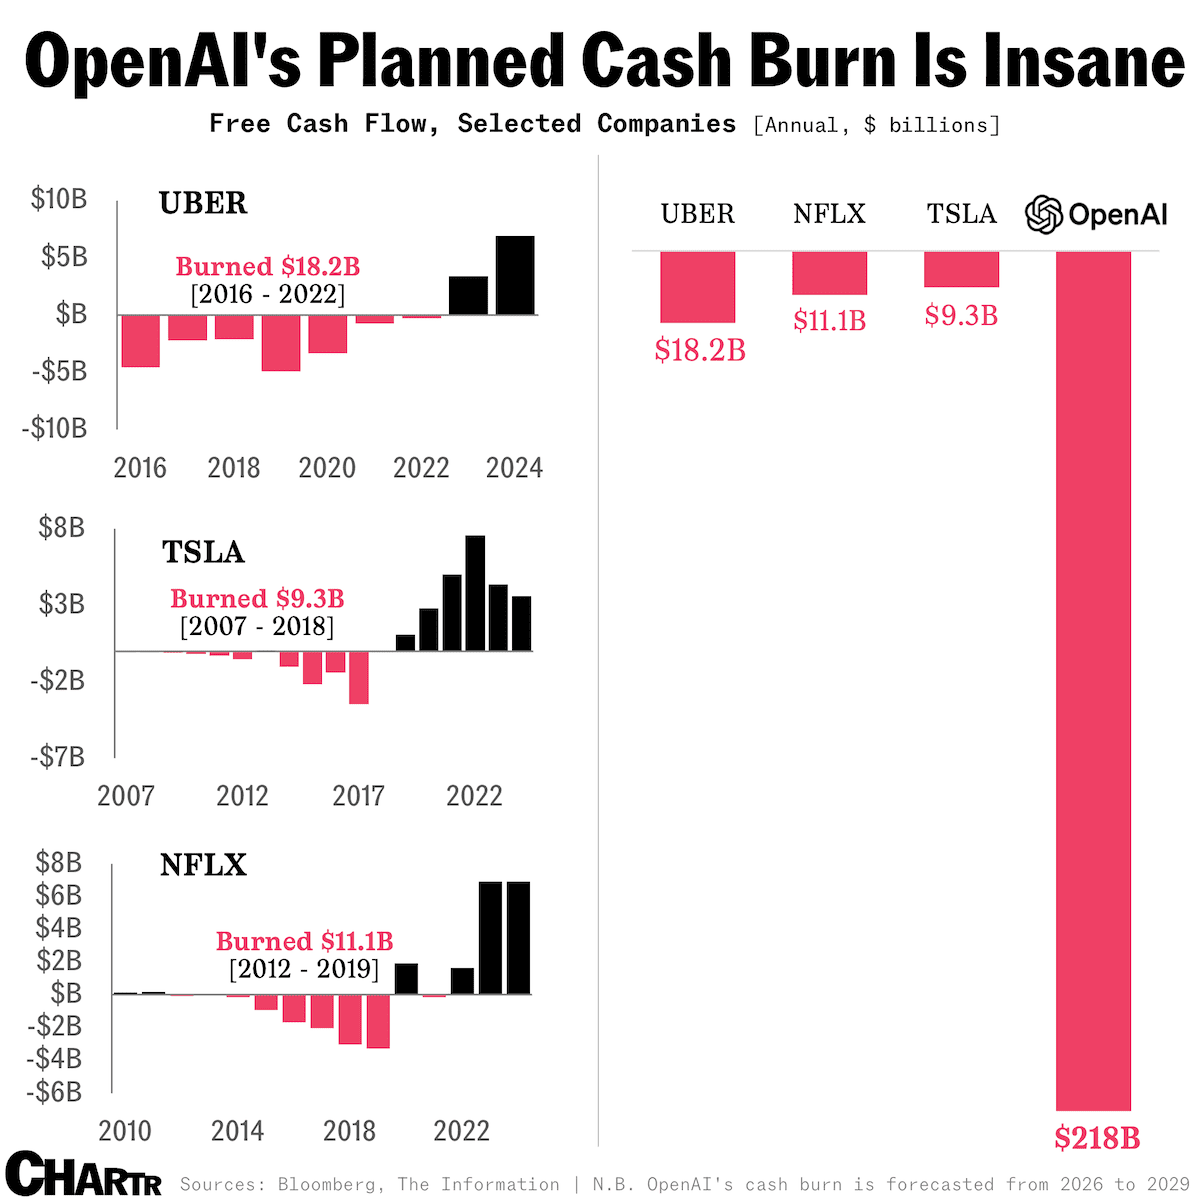
“OpenAI’s Planned Cash Burn Is Insane.” You get the takeaway before your eyes even reach the data. The pink bar at the bottom right ($218B) compared to the comparatively tiny bars for Uber, Netflix, and Tesla tells the whole story in a single visual beat. No legend hunting. No axis decoding. Just one color doing all the narrative work.
That’s the formula. And it breaks down into a few specific habits.
The headline IS the insight
Not “Free Cash Flow, Selected Companies.” That’s the subtitle, the context line. The headline states what you should think: the cash burn is insane. Every Chartr graphic works this way. The title tells you the conclusion. The chart proves it.
Same principle, different data: not “CPI Over Time” but “Inflation hit a 40-year high.” You know the takeaway before you even look at the chart. The chart’s job is to confirm and add nuance, not to reveal. If someone has to study your graphic to figure out why they should care, most of them won’t.
One chart, one insight
No multi-panel dashboards. No charts with two different y-axes competing for attention. No “and also while we’re here.” Each graphic communicates exactly one thing. This feels limiting until you realize that a chart trying to say three things usually says zero things to a casual viewer.
Strip away the decoration
“Chrome” is the design term for all the stuff around the actual data: gridlines, borders, tick marks, legends, axis lines. Look at that cash burn graphic again. No gridlines. Axis ticks reduced to the bare minimum for orientation. No legend needed because the color coding is self-evident (pink = cash burned, black = profitable). Every pixel that isn’t data or context is noise. The chart breathes.
Strategic annotation
The “Burned $18.2B [2016-2022]” callouts on each sub-chart do the heavy lifting. They tell you exactly what to take away from each company’s history without making you calculate anything. One annotation per panel, not five competing for attention.
Consistent brand
Same font. Same color palette. Same layout structure. After you’ve seen three Chartr graphics, you recognize the fourth before reading it. That recognition builds trust, and trust means people share without hesitation.
Look at the range of what they cover. A trend line showing tech companies entering the $4 trillion market cap club. A ranked horizontal bar chart showing that YouTube has become the biggest thing on television. A before-and-after comparison of streaming service prices with and without ads. Wildly different data, but the format is consistent and the insight always leads.
The Three-Second Rule
On social media, you have roughly three seconds before someone scrolls past. Your visualization has to communicate its core insight in that window or it’s gone.
Three seconds. That’s the headline, the chart shape, and maybe one number.
This means the headline needs to be large, bold, and in sentence case (not title case, which feels stiff and formal). The chart needs to confirm what the headline says at a glance. Color needs to direct attention, with the first or most important series getting the bold color. And all of it needs to be readable at thumbnail size on a phone screen.
This is fundamentally different from what exploratory visualization optimizes for. Exploration is about discovery: “What patterns exist in this data?” Communication is about confirmation: “Here’s the pattern. See it?” The chart is evidence, not a puzzle.
Most charting tools are designed for exploration. They prioritize flexibility over opinion. That’s a feature when you’re analyzing data and a liability when you’re sharing it. Their defaults produce output that’s functional and forgettable. You have to fight the tool’s instincts to make something shareable.
The three-second test is useful as a gut check. Before you publish anything, shrink your browser window to phone size and glance at the graphic for three seconds. Then look away. What do you remember? If the answer is “a chart,” keep editing. If the answer is a specific fact or number, you’re there.
Actionable Design Principles
Write the headline first
Before you open any charting tool, write the headline. This is the most important step and the one most people skip. If the headline isn’t interesting, the chart won’t be either. No amount of design polish fixes a boring insight.
“Revenue grew 100% from 2020 to 2022” is a headline. “Revenue by Year” is a label. One makes you curious. The other makes you scroll past.
If you can’t write an interesting headline, you might not have a shareable insight yet. That’s fine. Not every dataset contains something worth communicating broadly. Better to know that before you spend an hour on design.
Pick the right chart type (it’s usually simpler than you think)
Rankings? Horizontal bars. Change over time? Line chart. Parts of a whole? Stacked bars. Before/after comparison? Two dots connected by a line (sometimes called a dumbbell chart). Correlation? Scatter plot.
You need fewer chart types than you think. Something like 80% of Chartr’s output uses just three: line, bar, and stacked bar. The Economist’s graphic detail section relies on a similarly small set. These aren’t boring choices. They’re legible choices.
If you find yourself reaching for something exotic, stop and ask whether a bar chart would actually communicate the insight more clearly. The answer is usually yes.
Typography hierarchy
This matters more than color, and almost nobody gets it right. Here’s the stack:
- Headline: Bold, large, dark. This is what people read first and sometimes the only thing they read.
- Subtitle: Regular weight, medium size, gray. This is where you add methodology context (“Seasonally adjusted, monthly data since 1990”).
- Axis labels: Medium weight, small, light gray. Just enough to orient the reader.
- Source line: Regular, small, lightest gray. Bottom of the graphic.
The visual hierarchy tells people what to read first. When everything is the same size and weight, nothing is important, and the viewer’s eye wanders.
Color discipline
Maximum five distinct colors per graphic. That’s a hard cap, not a guideline. More than five and the viewer can’t keep track of what’s what.
Give the most important series your primary color (usually a saturated blue or teal). Use gray for context and secondary data. This creates an instant visual hierarchy: colored things are the point, gray things are the background.
Never use pure black for data elements. It’s too heavy. Dark gray (#333 or #374151) feels more natural and lets the chart breathe. Reference lines and targets should be dashed and light gray.
If you’re comparing just two things, use one color and one gray. Don’t give them both saturated colors. The colored one is the story. The gray one is the baseline.
Social dimensions
Design for the platform where your audience lives. This is tedious but matters a lot.
- Twitter/X: 1200x675 pixels (16:9). This is the preview card ratio.
- LinkedIn: 1200x627 pixels (1.91:1). Slightly wider than Twitter.
- Instagram: 1080x1080 pixels (1:1). Square format, more vertical space for text.
Most people design at whatever dimensions their tool defaults to and then wonder why their charts look awkward in social feeds. The chart gets cropped or letterboxed and the headline gets cut off. Spending 30 seconds setting up the right canvas size avoids this entirely.
Source attribution
Always include it. Bottom-left or bottom-right, small, gray. “Source: Bureau of Labor Statistics” or “Data: World Bank, 2024.”
It takes almost zero space, and the payoff is real. A source line is often the difference between “some chart I saw online” and “this looks authoritative.” It also helps curious readers dig deeper, which is a gift to your most engaged audience.
If you’re combining multiple sources, list them all. “Sources: Census Bureau, BLS, Federal Reserve.” Transparency is free.
What Separates Good From Great
The best data communicators (Chartr, Visual Capitalist, The Economist’s graphic detail team) share one habit: they treat the chart as supporting evidence, not the star of the show. The insight leads. The visual confirms.
This inversion is the hardest habit to build if you come from a data background. You fell in love with the data. You want to show all of it: the interesting outliers, the unexpected patterns, the rich texture. Cutting feels like a loss.
But the best communicators fell in love with their insight and show only what supports it. Everything else gets cut. Not because it’s uninteresting, but because it dilutes the message. You can always make a second chart.
None of this requires expensive tools or technical sophistication. These principles work in Excel, Google Sheets, ggplot2, D3, Datawrapper, or whatever you already know. A simple bar chart with a clear headline, clean typography, and disciplined color will outperform a technically impressive interactive visualization every single time.
Not because the internet has bad taste. Because the internet has three seconds.