Today we’re open-sourcing OpenChart, the charting library behind every visualization on OpenData. MIT-licensed, spec-driven, and designed to produce publication-quality output without 200 lines of config overrides.
You know the gap. You want your charts to look like they belong in The Economist or a Chartr newsletter: clean typography, proper source attribution, a headline that carries the insight. But the library you’re using gives you a default bar chart that screams “made with a library,” and getting from there to editorial polish means CSS hacks, fighting the framework’s opinions about where labels go, and a bunch of time you’d rather spend on the actual analysis. Most teams just ship the defaults and move on. The juice isn’t worth the squeeze.
What OpenChart Actually Is
OpenChart is a spec-driven visualization library. You describe what the chart should communicate in a JSON spec, and the engine handles everything else: scales, axes, labels, colors, responsive layout, accessibility.
const spec = {
  mark: { type: "area", interpolate: "monotone", point: true },
  data: [
    { date: "2023-01", price: 130.21 },
    { date: "2023-02", price: 147.41 },
    // ... 24 monthly closing prices
  ],
  encoding: {
    x: { field: "date", type: "temporal" },
    y: {
      field: "price",
      type: "quantitative",
      axis: { title: "Share Price", format: "$,.0f" },
    },
  },
  annotations: [
    {
      type: "range",
      x1: "2023-02-15",
      x2: "2023-04-01",
      label: "SVB collapse",
      fill: "#dc2626",
      opacity: 0.08,
    },
    { type: "refline", y: 181, label: "2-yr avg: $181", style: "dashed" },
    { type: "text", x: "2024-12", y: 243, text: "Record close: $243" },
  ],
  chrome: {
    title: "Apple Shares Hit Record After AI-Fuelled Rally",
    subtitle: "AAPL monthly closing price, Jan 2023 to Dec 2024",
    source: "Source: Nasdaq historical data",
  },
};
The spec IS the API. Not a component tree. Not imperative drawing calls. A declarative description that can be stored in a database, generated by an LLM, version-controlled, or validated before anything touches the screen. You can diff two specs to see exactly what changed between chart versions. You can generate them programmatically and inspect them before rendering. The spec serializes as plain JSON, so it works anywhere JSON works.
If you’ve used Vega-Lite, the encoding model will feel familiar. Each channel (x, y, color, size) maps a data field to a visual property with a type hint (quantitative, temporal, nominal, ordinal), and the engine picks the right scale and palette from there.
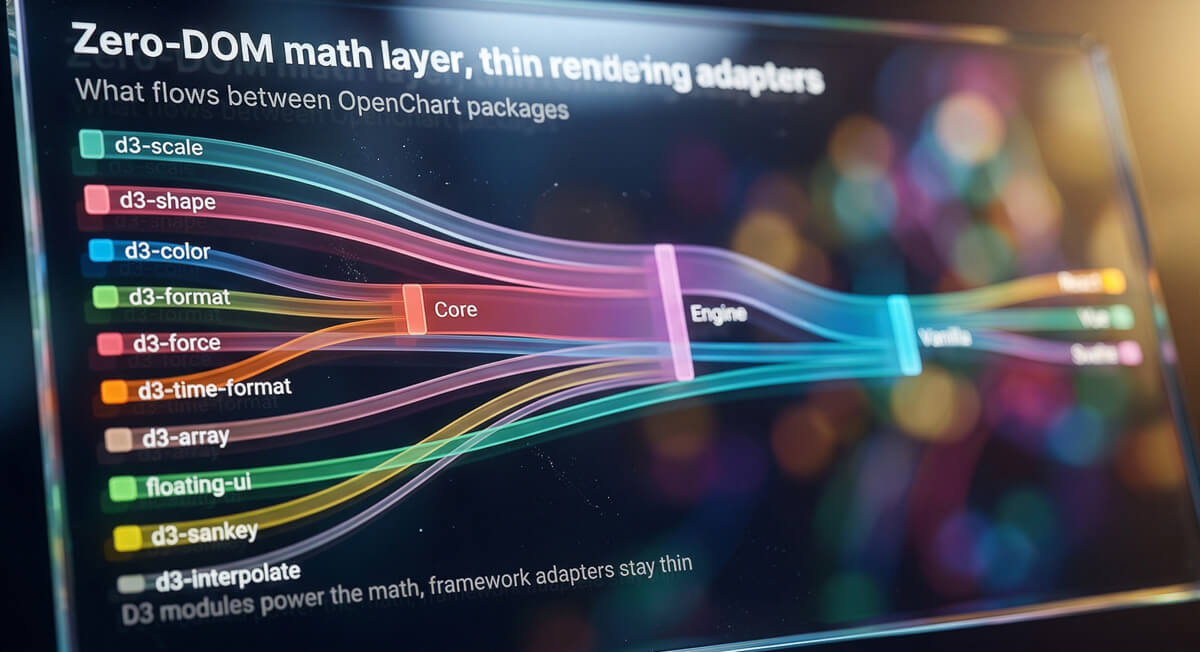
Headless Architecture
The engine is split into packages with a strict dependency chain:
The math layer (@opendata-ai/openchart-engine) has zero DOM dependencies. It takes a spec plus dimensions and produces a layout object with every position computed to the pixel. Scales, tick marks, label positions, mark coordinates, annotation anchors, accessibility metadata. All of it resolved to concrete values. The renderers (@opendata-ai/openchart-vanilla, @opendata-ai/openchart-react, etc.) are thin layers that walk the layout object and draw.
This split has real consequences for how you work. You can test chart logic with plain Vitest, no jsdom, no browser. “Does this dataset produce the right Y-axis domain?” is a unit test that runs in milliseconds. You can render on the server without Puppeteer. The same compilation step produces identical output in Node.js and the browser. And if you need to support a framework that doesn’t have a wrapper yet, you’re writing a thin rendering adapter, not reimplementing chart math.
The @opendata-ai/openchart-vanilla package handles SVG and HTML rendering, resize observation, and chart exports. The framework-specific packages (@opendata-ai/openchart-react, @opendata-ai/openchart-vue, @opendata-ai/openchart-svelte) are lifecycle bridges. The React <Chart /> component is roughly 30 lines: it creates a ref, calls createChart() on mount, and chart.update(spec) when props change. That’s it.
Editorial-First Design
Most chart libraries treat titles and source attribution as afterthoughts. You pass a string, the library sticks it somewhere with default styling, and you’re left tweaking font sizes in CSS. Annotations are worse: most libraries either don’t support them or offer escape hatches into the raw SVG.
OpenChart treats these as first-class structural elements because that’s what separates a chart from a visualization. The headline IS the insight. One chart communicates one thing. Minimal chrome, strategic annotation. Titles, subtitles, source attribution, and annotations are all first-class fields in the spec, not afterthoughts you bolt on with CSS.
Annotations come in three types: reference lines (baselines, thresholds), range highlights (recession bands, target zones), and text callouts (labels pointing to key data points with connector lines). A reference line at the national average. A shaded band marking a recession. A callout on the inflection point where the trend reversed. All declarative, all in the spec, all positioned by the engine’s math layer. That’s the difference between “here’s some data” and “here’s what you should notice.”
What You Can Build
The mark vocabulary covers the standard chart types (line, area, bar, point, arc, lollipop, etc.) plus Sankey diagrams for flow visualization. The engine infers things like vertical vs. horizontal bars from the encoding, and arc with an optional innerRadius handles both pie and donut, so the mark set stays small without limiting what you can build.
A few things worth highlighting: there’s a built-in data transform pipeline (filter, bin, calculate, timeUnit, aggregate, fold) so you can reshape data inside the spec without preprocessing. Layer composition lets you overlay marks for combo charts like bar + line. Gradient fills work on bars, areas, and arcs. Entrance animations are staggered by default and respect prefers-reduced-motion. And an annotation editor makes callouts and reference lines draggable in the browser, so you can fine-tune positioning visually.
Rich data tables go well beyond basic HTML: sorting, search, pagination, heatmap cells (color-coded by value), inline bars (mini bar charts in each cell), and sparklines (embedded line, bar, or column mini-charts showing trends). The table compiler handles all the layout math headlessly, same as charts.
Force-directed network graphs with canvas rendering handle larger datasets where SVG would choke. Nodes, edges, labels, collision detection, all computed by the engine and rendered to a canvas element.
All chart types support dark mode, responsive breakpoints, deep-mergeable theme configuration, and export to SVG, PNG, JPG, or CSV.
Accessibility
Accessibility is computed during compilation, not bolted on after rendering, which means it’s testable without a browser.
The engine auto-generates alt text from the spec and data. “Bar chart showing CPI by Category across 3 categories (3 data points).” Every mark in the layout carries an ARIA label. “Food: 332.” The renderer maps these to aria-label attributes on the corresponding SVG elements.
Color-blindness simulation uses Brettel, Vienot, and Mollon matrices for protanopia, deuteranopia, and tritanopia. checkPaletteDistinguishability() takes a palette and a deficiency type, simulates how each color appears, and verifies that all pairs maintain sufficient perceptual distance. WCAG contrast checking is built into the color system with contrastRatio(), meetsAA(), and findAccessibleColor() (which binary-searches for an adjusted variant that preserves hue while meeting the 4.5:1 threshold).
You can verify all of this in a unit test running in Node. No browser, no screen reader emulation. Just assertions against the compiled layout.
Network Graphs
Not everything is a bar chart. Some data is fundamentally about relationships: dependency trees, social networks, knowledge graphs. OpenChart’s Graph type renders these on canvas with force-directed layout, clustering, zoom, pan, and node dragging. The canvas renderer keeps things smooth at a couple thousand nodes, which is where SVG-based graph libraries tend to fall over.
The graph below is a synthetic npm-like ecosystem with 2,000 packages. Hub packages (react, lodash, express) naturally pull to the center because they have the most connections. Category clustering groups related packages spatially. Try zooming in on a cluster, or dragging a node.
Built for Agents
There’s a reason OpenChart uses a Vega-Lite-style spec instead of a component API. JSON is the native output format of LLMs. When a chart is just a JSON object with a predictable structure, an AI agent can generate it directly from data without scaffolding components, importing renderers, or writing imperative drawing code. The agent reasons about what story the data tells, picks the right chart type, maps fields to encoding channels, writes a headline that carries the insight, and hands back a spec that’s ready to render.
We built an OpenChart skill that teaches coding agents how to do exactly this. The skill goes well beyond API docs. It embeds editorial and design expertise: chart selection logic based on perceptual science (Cleveland & McGill’s accuracy hierarchy), color-as-narrative strategies, data resolution trade-offs, a 14-point first-draft checklist, and 40+ design review criteria. An agent with this skill loaded produces good visualizations, not just valid ones.
In practice, it works like this: you give your agent some data and tell it you want a chart. The agent loads the skill, reasons about what type of visualization fits the data, writes a spec with proper encoding, annotations, and editorial chrome, and hands it back. You render it with <Chart spec={spec} />. That’s the whole workflow.
To install the skill in Claude Code:
# Add the plugin marketplace
claude plugin marketplace add tryopendata/skills

# Install the OpenChart skill
claude plugin install openchart@opendata-skills
Once installed, give Claude some data and ask it to visualize it with OpenChart. The agent handles chart selection, encoding, annotations, theming, and editorial framing. You review the spec, render it, done.
The skill works across all of OpenChart’s rendering targets (React, Vue, Svelte, vanilla JS), so it doesn’t matter what framework your project uses. And because the output is plain JSON, you can store specs in a database, version-control them, or pipe them through a validation step before rendering.
Getting Started
Installation is one line:
npm install @opendata-ai/openchart-react
# or
npm install @opendata-ai/openchart-vue
npm install @opendata-ai/openchart-svelte
npm install @opendata-ai/openchart-vanilla
The live demo has interactive examples for every chart type, annotation editing, dark mode, responsive layouts, and table features.
Source is on GitHub: github.com/tryopendata/openchart
If you’ve ever spent more time fighting your chart library than analyzing your data, give OpenChart a look. And if you build something cool with it, we’d love to see it.